Nowadays, when you’re watching a broadcast of a match on TV, you see a lot of additional information scrolling through your screen. One of the first pieces of data to have been presented in such a way – since the clock and score were no longer enough – was the ball possession percentage. And since that comparison began to appear, people have been asking themselves “How is this actually calculated?” Find out with STATSCORE!
The question is not unfounded at all, and stormy discussions about it continue to this day. In the end, it is about how the notion of possession is understood and interpreted.
Firstly, maybe we should look at the popular definitions of ball possession in football, which tell us that possession is the amount of time a team controls the ball during a match.
There is some controversy even at this stage – is the amount of time really the best basis for this statistic? After all, if a goalkeeper controls the ball for 15 seconds, without doing anything special with it, can it work in any way for the benefit of his team? Apart, of course, from the situation when his team is winning and there is just one minute left until the end of the match?
It’s generally assumed that a higher percentage of ball possession testifies to the team’s advantage. However, at this point, we would need to consider whether this data should actually be treated as a direct indicator of advantage.
But before we consider the impact of ball possession on the final result, let’s go back to the opening question…
How is ball possession calculated?
The turn of the 21st century is undoubtedly the beginning of the era of football enlightenment. The impact of technology development on sports has changed the way people follow and understand it. But it doesn’t mean that earlier nobody had analysed matches and performances. People had their own ways to measure different statistics, and ball possession had its own measurement method.
Calculating ball possession by a manual clock
In the early times, the first method to calculate ball possession was to manually control the clock. A person responsible for it had to start measuring time when a player of a given time began to possess the ball and to stop the clock when the team lost the ball. This kind of metric was, naturally, far from perfect, if only because of the human factor. People would sometimes forget to switch the clock or did it at a wrong moment.
Measuring ball possession by calculating passes
Years were passing, the world went ahead, technology kept advancing. Various companies started to take sports business more seriously and began to offer their services for that industry. Some of them worked with sports stats, including ball possession.
Another calculation method was developed, which consisted in summing up the numbers of passes of one team during the match and dividing it by the number of total passes made by both teams. It was a good solution in many ways, as it allowed to limit human errors, but it did not completely eliminate discrepancies. Moreover, it was one of the arguments for using automatic calculations by the companies.
This method had one main downside – it didn’t include the time when players were on the ball. This could cause considerable distortions, despite the declaration that the results of these measurements do not differ significantly from the “time method”.
The newest way to measure ball possession
Today sports-related companies are using the newest technology and counting stats in more complex ways. For example, ball possession is measured by three people who are using a video-based data collection tools during a match, which allows them to determine the time during which player has contact with the ball, location of that contact, and even type of the contact.
There will be still a question about more sensitive aspects like headers, tackles or out-of-play balls, which often take about half of the game time.
How is ball possession calculated by STATSCORE?
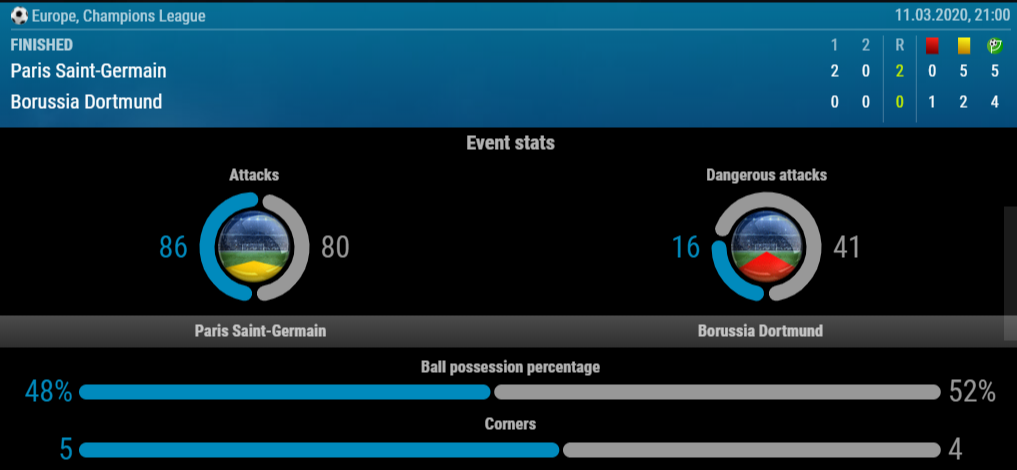
Ball possession at STATSCORE is calculated in a very specific way. When our live scout is covering a football match, there is a special, additional time counter running in the background. It can be compared to the chess clock. Each team has its own clock ticking. When the first team is on the ball – the time is counting by its side. When the second team makes an interception and takes the control of the ball, the first team’s clock stops, while the second team’s clock starts to measure its time.
This time-measuring method has to take into account various incidents happening on the pitch. For example, when a team is preparing to take a corner kick, or when a player is injured and there is a break during the game, the clock is stopped for both teams.
Finally, the amount of calculated time is converted into a percentage, which is displayed on STATSCORE stats and trackers.
Someone could ask if this data really reflects what’s going on on the pitch? What about the time when a team is preparing to take a set piece of the game? Is it still on the ball at that moment?
The method applied by STATSCORE ensures that it will be counted out to make sure that the ball possession percentage includes only the time when a team was actually on the ball during the actual action. This solution allows us to avoid all types of distortions.
How does ball possession matter in football?
In football, it has become a common belief that ball possession is important and has a significant impact on the final result of a match. When a team is having the ball for most of the game time, it is accepted that they are the dominating side.
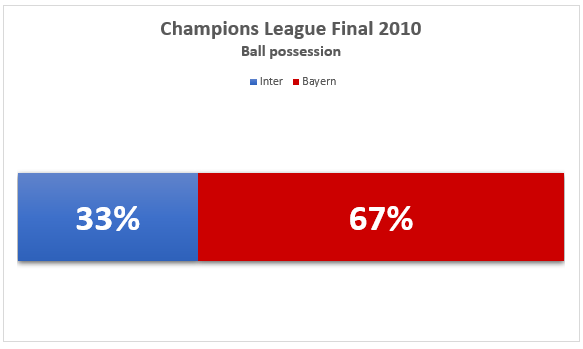
However, football and statistics are an explosive combination that often loves to play tricks on its lovers. It is no different this time. When we take a look at the finals of the biggest tournaments – UEFA Champions League and FIFA World Cup, we can come to a conclusion that ball possession may after all not mean anything. It turns out that Champions League was won in turns by teams who were most of the time on the ball, and those focused on defence and quick attacks. And these differences on the ball possession were often substantial. The success of Jose Mourinho’s Inter in 2010 is probably the best example here. The team had less ball possession on average in all their games, as well as in their final match against Bayern (only 32%!)
Taking a look at the finals of the Champions League in last years, we could deduce that champions of the ball possession were… Real Madrid. Of course, it is a very direct, straightforward conclusion, but also a fact. They won this tournament the most times in recent years and almost every time they supported their wins with the advantage of ball possession. There was one exception though, in the 2016 final game against Atletico, Los Colchoneros spent more time on the ball, which can be seen as quite a paradox. However, Atletico failed to take advantage of this course of the match, and after a penalty shoot-out, it was Real Madrid to enjoy the success.
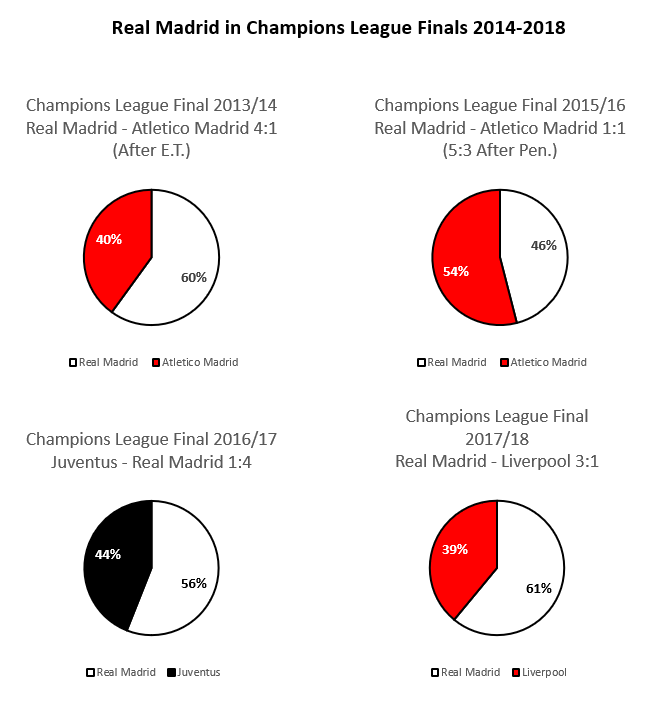
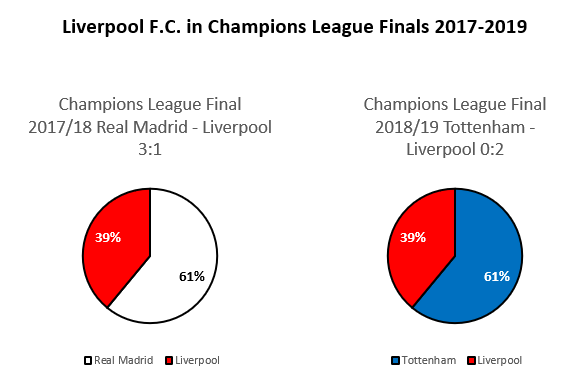
Equally interesting case is Liverpool as they took part in Champions League finals in two last seasons. In each of them, the Reds had less ball possession than opponents (39%). As we know perfectly well, they lost the first final against Real Madrid, to beat Tottenham the following year. Therefore, in this case, it can be pointed out that it was not the ball possession that mattered most to the result, but other factors like the specificity of the rivals, course of the game or goalkeepers’ performances.
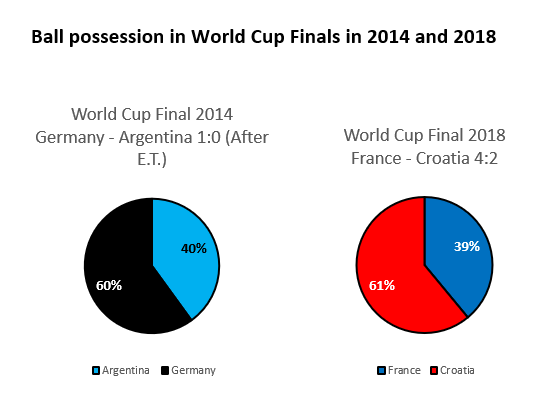
When it comes to the last World Cup’s finals, here also no definite conclusions can be drawn either. In the 2018 final game, Croatia was dominated by the French team despite its big advantage in ball possession (61%), while the Germans in 2014 sealed their domination on the ball (60%) by the goal in the extra-time against Argentina.
We cannot ignore the mention of the historical match here, where Celtic beat Barcelona only with 27% of the ball possession. That was a great celebration of their 125 anniversary…
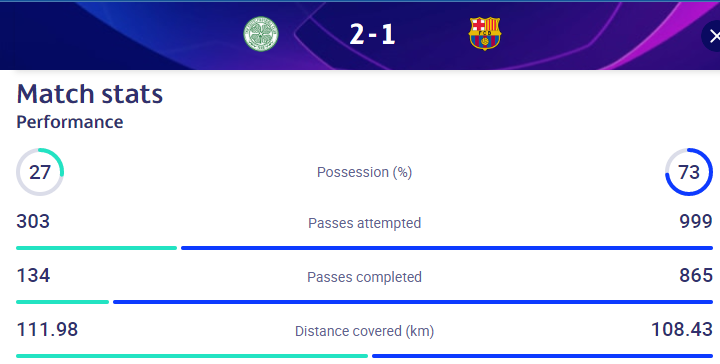
Source: uefa.com
Of course, we can’t treat these last years finals’ of the biggest competitions as a direct basis for all of the matches and teams in the whole football. However, taking part in these finals is possible only for teams on the highest level and they should constitute the best source of analysis.
Some time ago, soccerment.com did a great job by analyzing the top 5 European leagues in terms of the impact of ball possession for the final results, not only in a single match but the whole season. In that analysis, the conception about the importance of ball possession for the final result was proved to have much more sense. In fact, it was generally confirmed that the teams with a higher percentage of ball possession generally had better results in their matches.
Sign up for our newsletter to stay updated with the latest trends, and key developments in the world of sports data and betting. You can do it by filling the form below.

